Project Outline:
As can be read in the Define Phase Blog the goal of this project is to increase the yield of the Swiss Turn Lathe process that will be introduced to the Manufacturing site in 2018.
As can be read in the Define Phase Blog the goal of this project is to increase the yield of the Swiss Turn Lathe process that will be introduced to the Manufacturing site in 2018.
As a result of the completion of the Define Phase and subsequent project review by the project sponsor a realignment of the Project Charter was conducted to further define the project scope to ensure that the project charter satisfied the SMART requirements.
S : Specific
M : Measurable
A : Achievable
R : Relevant
T : Time Bound
This Acronym is a vital tool to help to ensure that the right projects are defined and actioned within a manufacturing site.
Specific:
The initial project charter specified to increase production yield. This target was not specific enough to have a properly defined project target. The project goal has been now fully defined as the reduction of Micro Drill Defects in the Swiss Turn Process by 80%, from 11% to 2% by 16th April 2017.
Measurable:
This project goal is now fully specific. The defect Rate is measurable throughout all development runs.
Achievable:
Based on process knowledge the result is believed to be achievable within this project.
Relevant:
The relevance of the project is driven by the Manufacturing Transfer agreement which will not allow for the transfer of a project from development to production based on the current yield projections.
Time Bound:
The project is also accurately Time bound as the project deadline for the product transfer to production aligns with the timeline within this project.
Based on the realigned project scope we are now fully compliant on the SMART deliverable required within the Manufacturing Site for Green Belt Projects.
Measure Phase:
Phase Learnings:
The key learning that I have taken away from this stage of the project is to fully ensure that before moving on in the process it is vital to ensure that you have an assessment system in place that will fully capture the data required and will ensure that a robust Analyse and Improve Phase can be implemented.
One other learning is that it is never too early to start the measurement phase. For this project there will be only 3 data sets available as we move into the Analyse Phase. Ideally the more data that you have the more assured you can be regarding the correct direction of the project. However I can also see a potential for having too much data and becoming bogged down in the data before the project starts.
The Define phase data that was collected greatly overlapped with the Measure phase and formed the basis of the direction that the Measure Phase was conducted in.
To that end whilst it is not ideal to have so few data sets it is clear from these data set that a process problem is present.
From the Pareto Analysis the Micro Drill Defects account for over 94% of the defects seen through out the production run.
These defects were further assessed and the Micro Drill Defects were further defined to 3 distinct categories:
Incomplete Micro Drill with Burr
Complete Micro Drill with Burr
Incomplete Micro Drill without Burr
All of the above defects result in a product that is deemed to be scrap.
To this effect the data we are utilising will be Attribute data.
Dealing with attribute data will bring challenges to the project in the Analyse phase.
For the Measure phase a data collection plan was implemented and a better defined process monitoring has been introduced across all batch runs with Micro Drills. This data is collected in a Pass Fail Criteria, a Defect Compilation and also in a run chart format.
This Measure data was utilised to complete a P Chart for Attribute Data.
The key phase learning that I have taken from this project is the importance for implementation of robust data collection for as early as possible when working on a process.
As it stand for this projects we have now attained three data sets which will be utilised for compilation of the P Control chart.
Using the Flow Chart for Chart Selection a P Chart is deemed the suitable chart as the data set size is variable and the the data is tracking a defective part.
 |
| Attribute Chart Type Selection (Ref Lecture 16 Course Notes) |
Tools Used:
P Chart:
The P chart variables were then calculated utilising the P Chart equation:
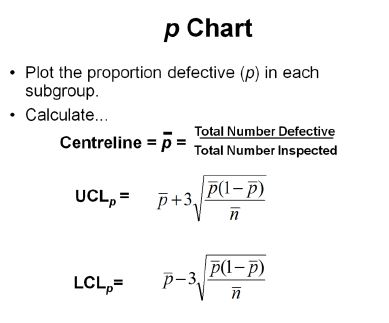 |
| P Chart Calculation Formulas (Ref Lecture 16 Course Notes) |
The data was then defined based on the following attribute data
 |
| Batch Run Mirco Drill Defect Data |
Utilising the Data above the The Centre Line and UCLp were defined as 0.0923 and 0.1684 respectively.
 |
| P Chart of Run Data |
MSA:
A trial MSA has been completed with the three project members. This study is vital to the project as it helps to define if a viable inspection method has been developed to detect the defect on the parts.
This tool is used in conjunction with the visual standards that have been defined for the process.
From the Trial MSA data it is evident that an acceptable inspection system has been implemented to visually inspect these parts for defects.
From the MSA data we can see a number of parts were incorrectly identified. The root cause of these incorrect definitions was due to operator distraction. An official MSA will be conducted prior to product launch with trained operational personnel. This is a key project goal and for the purpose of this test we are happy to accept the results as is and to progress with the defect assessment in this way.
 |
| Type 2 Trial MSA |
No comments:
Post a Comment